InfluxDB and Grafana

 The InfluxDB database is a so-called time series database primarily designed to store sensor data and real-time analytics.
The influxdb component makes it possible to transfer all state changes from Home Assistant to an external InfluxDB database.
The first step is to install the InfluxDB packages. If you are not running Fedora, check the installation section for further details.
$ sudo dnf -y install http://influxdb.s3.amazonaws.com/influxdb-0.9.5.1-1.x86_64.rpm
Launch the InfluxDB service.
$ sudo systemctl start influxdb
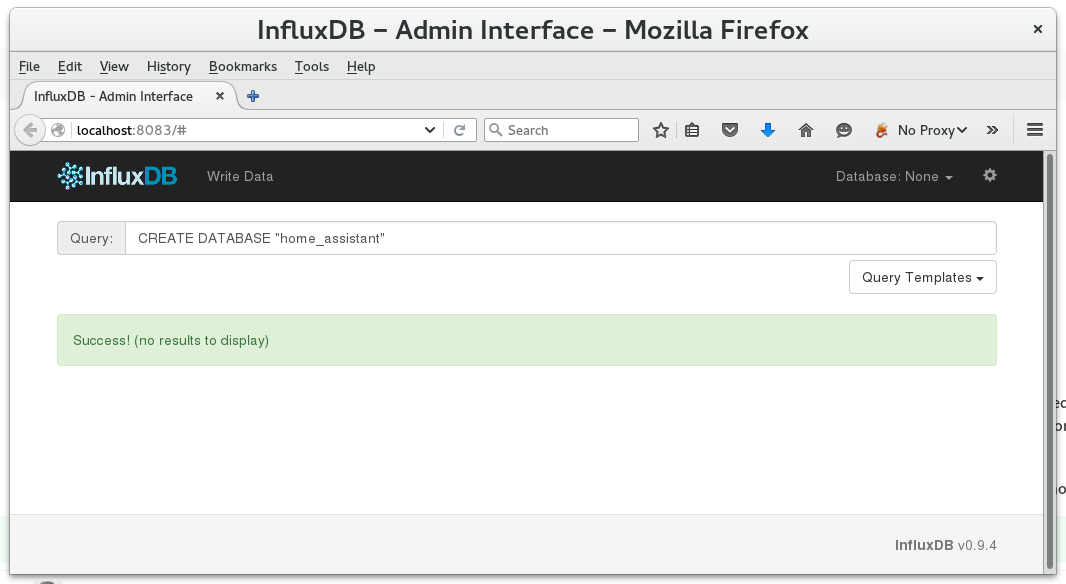
If everything went well, then the web interface of the database should be accessible at http://localhost:8083/. Create a database home_assistant to use with Home Assistant either with the web interface or the commandline tool influx.
 InfluxDB web frontend
$ influx
Visit https://enterprise.influxdata.com to register for updates, InfluxDB server management, and monitoring.
Connected to http://localhost:8086 version 0.9.5.1
InfluxDB shell 0.9.5.1
> CREATE DATABASE home_assistant
An optional step is to create a user. Keep in mind to adjust the configuration (add username and password) in the next step if you prefer to go this way.
> CREATE USER "home-assistant" WITH PASSWORD 'password'
To use the influxdb component in your installation, add the following to your configuration.yaml file:
influxdb:
  host: 127.0.0.1
After you restart Home Assistant you should see that the InfluxDB database gets filled. The language to query the database is similar to SQL.
$ influx
[...]
> USE home_assistant
Using database home_assistant
> SELECT * FROM binary_sensor
name: binary_sensor
-------------------
time			domain		entity_id	value
1449496577000000000	binary_sensor	bathroom_door	0
1449496577000000000	binary_sensor	bathroom_window	0
1449496577000000000	binary_sensor	basement_door	0
1449496577000000000	binary_sensor	basement_window	0
1449496684000000000	binary_sensor	bathroom_window	1
[...]
Grafana is a dashboard that can create graphs from different sources including InfluxDB. The installation is simple, and there are detailed steps for many different configurations on the Grafana installation page. For a recent system that is running Fedora:
$ sudo dnf -y install https://grafanarel.s3.amazonaws.com/builds/grafana-2.5.0-1.x86_64.rpm
Start the grafana server.
$ sudo systemctl daemon-reload
$ sudo systemctl start grafana-server
$ sudo systemctl status grafana-server
Login with the username admin and the password admin at http://localhost:3000/login. Now follow the InfluxDB setup instructions.
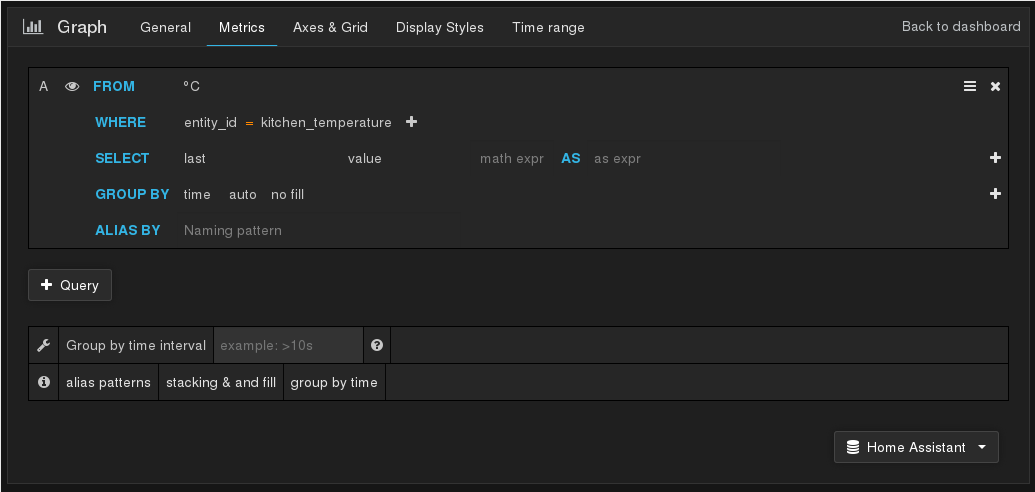
Now you can start to create dashboards and graphs. You have various options to get the data from the graph. The next image just shows a screenshot of the setting for a temperature sensor.
 Grafana settings
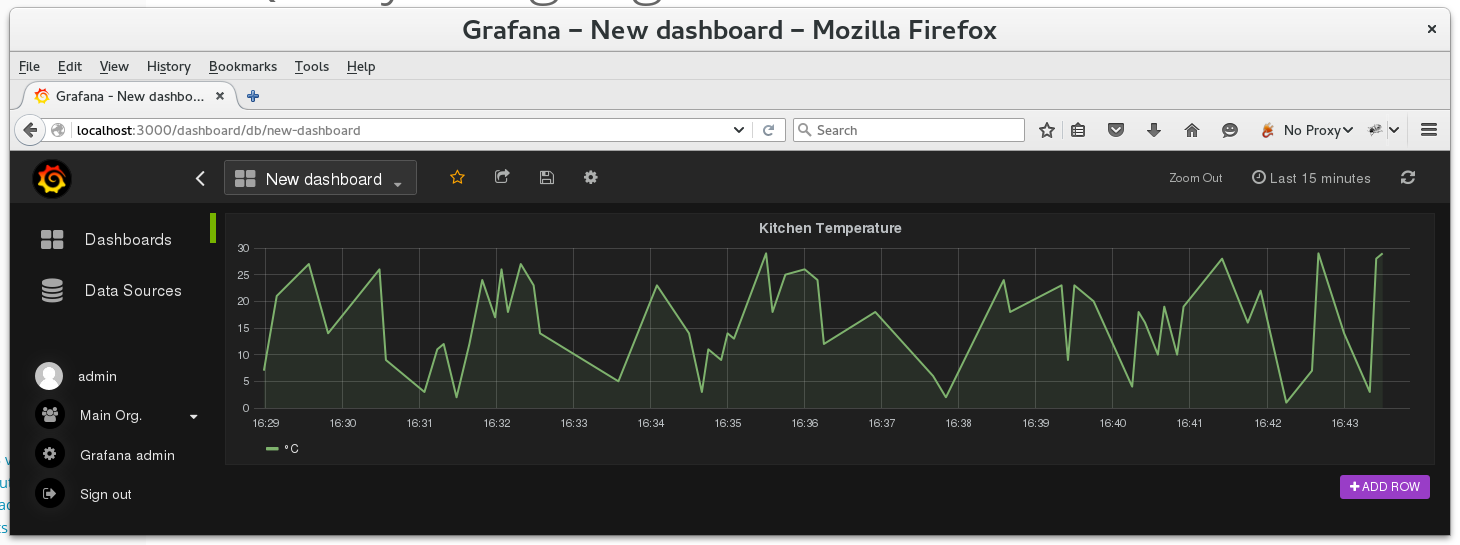
If the graph is not showing up in the dashboard you need to adjust the time range in the right upper corner. The graph is created for all state changes recorded by Home Assistant.
 Grafana Temperature graph